

An account can finish above its starting balance and still have suffered a deep loss from an interim high. Maximum drawdown measures that peak-to-trough decline. It also matters for trading psychology because a prolonged retreat from a previous high can pressure traders to abandon their rules, avoid valid setups or chase a quick recovery.
For forex traders, the number is useful only when its basis is clear: balance or equity, daily close or intraday value, and the treatment of deposits and withdrawals. The formula is straightforward; interpreting it is not. This guide explains the calculation, recovery math, tracking choices and limitations of the metric.
What Is Maximum Drawdown in Trading?
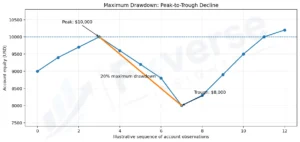
Maximum drawdown is the largest percentage decline in an account’s equity from a previous high-water mark to a later low during a defined measurement period. It records the worst peak-to-trough loss in that sample, not the loss on one trade and not a forecast of the next decline.
Unlike a loss measured only against starting capital, maximum drawdown follows the running high-water mark. An account can end a period in profit and still have suffered a sharp interim decline. The statistic captures that route, not just the opening and closing balances.
Maximum drawdown can be expressed as a monetary amount or a percentage. The monetary figure shows the size of the decline, while the percentage shows how large that decline was relative to the previous equity peak.
Drawdown can include unrealized losses when calculated from marked-to-market equity. Results also depend on whether the record uses closed balance or live equity, end-of-day or intraday values, and which dates are included. State the basis before comparing accounts or strategies.
How Do Traders Calculate Maximum Drawdown?
Track each account-equity value, compare it with the highest value reached before it, and calculate the percentage drop to each subsequent trough. The largest drop is maximum drawdown:
Maximum drawdown (%) = (Peak equity − Trough equity) ÷ Peak equity × 100
For example, if equity reaches $10,000 and then falls to $8,000, the drawdown is ($10,000 − $8,000) ÷ $10,000 × 100 = 20%. A later recovery to $10,000 returns the account to its previous peak; a new high-water mark forms only when equity exceeds that peak. A deeper trough before recovery would set a larger maximum.
When reviewing an equity history, the trough must follow the peak being measured. A low recorded before a later peak cannot be used to calculate the drawdown from that later high.
How Much Return Is Needed to Recover From a Drawdown?
Recovery requires a larger percentage gain than the preceding loss because the gain applies to a smaller remaining balance. The required return is drawdown ÷ (1 − drawdown), with drawdown expressed as a decimal. A 20% decline therefore needs a 25% gain to return to the original peak.
|
Drawdown from peak |
Gain needed to regain the peak |
|
10% |
11.1% |
|
20% |
25.0% |
|
30% |
42.9% |
|
50% |
100.0% |
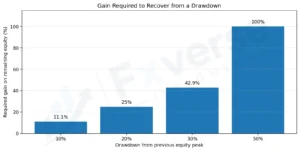
At a 50% drawdown, remaining equity is half its former peak, so it must double. For example, a $10,000 account that experiences a 30% drawdown falls to $7,000. It must then gain $3,000, or approximately 42.9% of its remaining equity, to return to $10,000. These figures describe arithmetic, not a recovery forecast or timetable. Further losses, spreads, commissions and swap costs can widen the gap.
Why Does Maximum Drawdown Matter for Trading Psychology?
Maximum drawdown gives traders a concrete record of how far their equity fell from a prior peak, making risk easier to review than a vague sense of being “down.” A large decline can intensify fear, hesitation or pressure to win losses back, but the metric itself does not diagnose a trader’s mindset.
Drawdown compresses a sequence of results into one visible number. A trader may respond by avoiding valid setups, changing a method mid-sample, loosening exits or increasing size to break even faster. These reactions are possible, not inevitable; the statistic signals a review point, not a diagnosis.
Use a journal to separate process from outcome: Were positions sized as planned? Did execution costs or slippage change? Did the trader depart from rules? A loss alone does not prove a method has failed, while repeated rule-breaking may show that exposure exceeds the trader’s tolerance.
How Should Forex Traders Track Maximum Drawdown?
Forex traders should track drawdown on a consistent equity curve that reflects both closed trades and open profit or loss, with deposits and withdrawals handled separately. Record the date, prior high, trough, percentage decline and time to recovery, then compare results using the same sampling method and cost assumptions.
Most platforms distinguish balance, which reflects closed trades, from equity, which generally includes open profit or loss. Equity tracking reveals floating drawdown earlier; a balance-only chart may hide it until a position closes. State whether the curve uses daily closes or intraday marks, and include costs and actual fills consistently.
Consider a forex account with a previous equity peak of $10,000. An open EUR/USD position moves against the trader, reducing current equity to $9,200 while the account balance remains unchanged at $10,000. The account has an 8% floating drawdown, even though no loss has been realized by closing the position. A balance-only report may not show this decline.
Deposits and withdrawals can distort account performance measurements. A deposit increases account equity without representing a trading profit, while a withdrawal reduces equity without necessarily representing a trading loss. When measuring strategy performance over time, use a cash-flow-adjusted method, such as a unitized equity series, so external transactions do not artificially create gains or drawdowns. Keep the treatment consistent throughout the measurement period.
Leverage does not change the drawdown formula, but a currency move can have a larger percentage effect on equity when notional exposure is high relative to capital. The CFTC warns that leverage magnifies forex gains and losses. Monitor margin separately because margin requirements may become binding intraday, depending on the broker, account and open positions.
What Can Maximum Drawdown Tell You—and What Can’t It?
Maximum drawdown describes the worst peak-to-trough decline observed in a selected historical series; it does not estimate the next loss or the probability of a future decline. It is path-dependent, so return order, sample length, valuation frequency and open-position treatment can change the measured result.
Two accounts can share a 15% maximum drawdown but differ sharply in duration: one may recover within days; another may remain below its prior peak for months. Track time to recovery alongside depth, and distinguish the worst episode from a typical one.
Historical maximum drawdown should also be considered alongside recovery duration and the frequency of losing periods. A strategy that experiences occasional deep declines may behave differently from one that remains below its previous equity peak for extended periods. These additional measurements provide context that maximum drawdown alone cannot capture.
Use it with per-trade risk, exposure across correlated currency pairs and available margin, not as a stand-alone score of strategy quality.
What Should Traders Remember About Maximum Drawdown?
Maximum drawdown is most useful as a plain record of the worst decline from a previous equity peak, measured consistently and read alongside duration, costs, leverage and the trader’s risk limits. It is not a forecast, a pass/fail grade, or a reason by itself to increase risk or abandon a method.
Predefine what happens when a review threshold is reached: audit rule adherence, execution, position size, correlated exposure and market assumptions. Do not increase risk simply to recover the old high. If risk is set at 1% of current equity, a $10,000 account plans $100; after a 20% drawdown, the same rule implies $80, assuming the trader recalculates position size using current equity and keeps other trade inputs unchanged. Fixed-lot sizing does not shrink automatically.
The purpose of tracking maximum drawdown is to understand the risk taken along the way, not to treat a historical maximum as a promised future limit.
Frequently Asked Questions
What is the difference between drawdown and maximum drawdown?
Drawdown is a decline from an account’s previous equity peak. Maximum drawdown is the largest peak-to-trough decline recorded during a specified measurement period.
Does maximum drawdown include unrealized losses?
It can. If the calculation uses marked-to-market equity, open-position profit and loss is included. A calculation based only on closed-trade balance may not show floating losses until positions are closed.
How is maximum drawdown different from a losing streak?
A losing streak is a sequence of losing trades. Maximum drawdown measures the largest decline in account equity from a previous peak, so it can include losses of different sizes, open-position losses and changes in equity between closed trades.
Can maximum drawdown predict future losses?
No. It describes the worst decline observed in the selected historical data. Future market conditions, execution, leverage and strategy performance can produce a larger drawdown.


Leave A Comment