
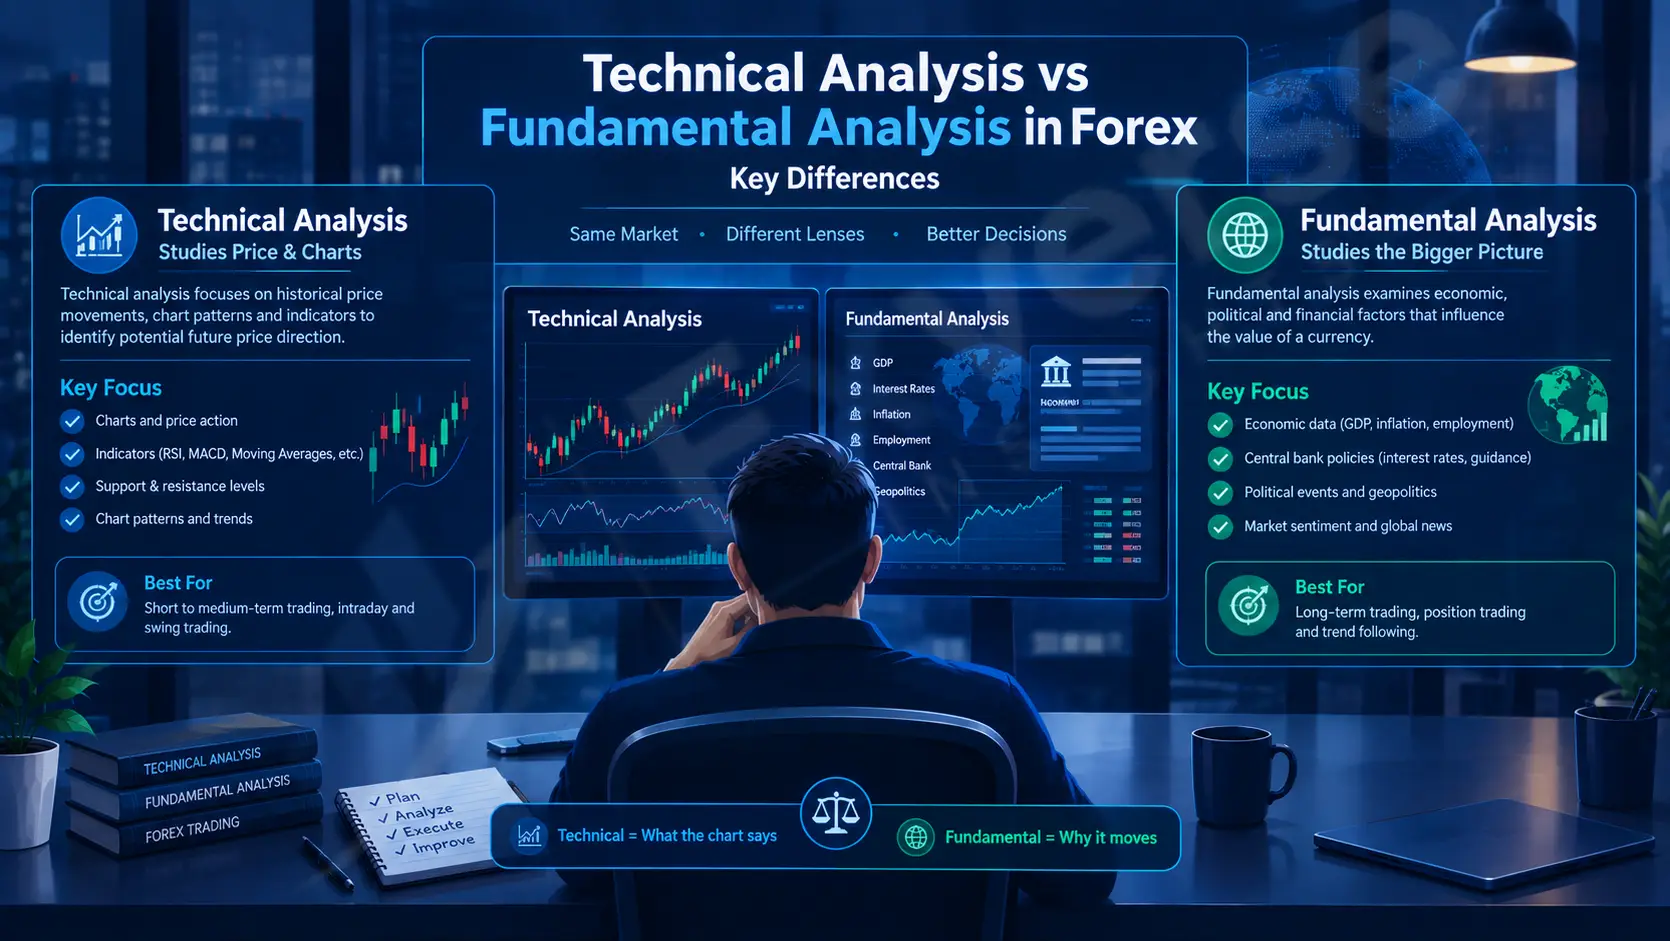
Every forex trader eventually faces the same fork in the road: study the charts, or study the economy behind the currency. Technical analysis vs fundamental analysis is not really a rivalry — it’s two different lenses for the same market, and most experienced traders end up using pieces of both rather than picking a side permanently. Understanding what each method actually measures, where each one breaks down, and how they intersect is the real starting point for making sense of forex analysis.
What Is the Difference Between Technical and Fundamental Analysis in Forex?
Technical analysis studies historical price charts and volume to forecast future currency movements, while fundamental analysis examines economic data, interest rates, and central bank policy to judge a currency’s underlying value. Traders often use one method, the other, or a blend of both to build trade decisions.
The distinction matters because it shapes what a trader looks at before opening a position. A technical trader stares at candlesticks, moving averages, and support levels. A fundamental trader reads interest-rate statements, inflation reports, and employment data. Neither lens is complete on its own, which is why most professional desks lean on both at different stages of a trade.
How Does Fundamental Analysis Work in Forex Trading?
Fundamental analysis evaluates a currency’s intrinsic value by studying the economic health of the country behind it. Traders assess interest rates, GDP growth, inflation, employment figures, and central bank policy to judge whether a currency is likely to strengthen or weaken relative to another over time.
Interest rate differentials sit at the center of this approach. When a central bank raises rates, it tends to attract foreign capital seeking higher yields, which can push the currency higher. When rates fall or are expected to fall, the opposite pressure often appears. This relationship is not mechanical, though — markets price in expectations well before an announcement, so the actual rate decision sometimes moves price less than the surrounding commentary about future policy.
What Economic Data Do Fundamental Traders Watch?
Fundamental traders track interest-rate decisions, inflation reports such as the CPI, employment data, GDP releases, and trade balances. These figures reveal the direction of a country’s economic momentum and often prompt the market to reprice a currency well before a central bank formally adjusts policy.
Employment data, particularly in economies with liquid currencies, tends to move markets quickly because it feeds directly into a central bank’s rate calculus. Inflation reports carry similar weight, since persistent inflation above target typically increases the likelihood of tighter monetary policy, and by extension, currency strength — though the relationship can shift when growth concerns dominate policymakers’ thinking instead.
How Does Technical Analysis Work in Forex Trading?
Technical analysis assumes that price action reflects all available information and that historical patterns tend to recur. Traders study charts, indicators, and price structure to time entries and exits, rather than asking why a currency should move, focusing instead on how it has been moving.
This approach rests on three loose premises: price discounts everything, price moves in identifiable trends, and history tends to repeat because market participants react to similar conditions in similar ways. None of these premises are laws of physics — they are working assumptions that hold often enough to be useful, not guarantees that any given pattern will resolve as expected.
What Are the Most Common Technical Analysis Tools?
Common technical tools include moving averages, the Relative Strength Index (RSI), MACD, trendlines, and support and resistance levels. Traders combine these tools to gauge trend direction, momentum, and potential turning points, using them to time trades rather than to determine a currency’s fundamental worth.
Moving averages smooth out short-term noise to reveal the broader trend, while oscillators like RSI and stochastic help traders judge whether a move has become overextended. Support and resistance levels mark price zones where buying or selling pressure has previously emerged, giving traders reference points for entries, exits, and stop-loss placement.
What Are the Key Differences Between Technical and Fundamental Analysis?
Technical analysis and fundamental analysis differ mainly in focus, timeframe, and the question each one answers. Technical analysis studies price and volume to time trades, while fundamental analysis studies economic data and policy to judge a currency’s underlying direction over a longer horizon.
| Factor | Technical Analysis | Fundamental Analysis |
|---|---|---|
| Core focus | Price charts, volume, patterns | Economic data, interest rates, policy |
| Typical time horizon | Short to medium term | Medium to long term |
| Primary tools | Indicators, trendlines, chart patterns | Central bank statements, CPI, GDP, employment reports |
| Question asked | When should I enter or exit? | Why should this currency move? |
| Main weakness | Patterns can fail without warning | Timing the market reaction is difficult |
Neither column represents a complete trading framework by itself. Technical analysis can flag that momentum has shifted without explaining the cause, while fundamental analysis can correctly identify an economic trend weeks or months before the price fully reflects it.
Which Time Horizon Suits Each Approach?
Technical analysis generally suits shorter time horizons — intraday to swing trades lasting days or weeks — because chart patterns and indicators react quickly to price action. Fundamental analysis suits longer horizons, since economic trends such as interest-rate cycles typically unfold over months or years rather than hours.
That said, the line blurs in practice. A scalper reacting to a surprise inflation print is trading a fundamental event on a technical timeframe, while a position trader building a multi-month thesis around a central bank’s tightening cycle may still use technical levels to decide exactly when to enter.
What Are Common Misconceptions About Technical and Fundamental Analysis?
A common misconception is that one method is objectively superior to the other. In practice, both rely on interpretation — chart patterns can be read differently by different traders, and economic data can be weighed differently depending on which factor a trader believes the market currently cares about most.
Another misconception is that fundamental analysis alone justifies ignoring price action entirely. A currency can remain “fundamentally strong” while still declining for weeks if market sentiment or positioning moves against it. Price, in that sense, eventually has the final word, which is why many fundamentally driven traders still watch charts for confirmation.
A third misconception treats technical patterns as guarantees. A textbook head-and-shoulders or breakout setup fails often enough that treating any single pattern as a reliable signal, rather than one input among several, tends to produce disappointing results over time.
How Do Traders Combine Technical and Fundamental Analysis?
Many traders use fundamental analysis to establish a directional bias and technical analysis to time the actual entry and exit. This hybrid approach treats economic data as the reason to favor a currency and chart structure as the tool for deciding where risk and reward are best balanced.
[External Source: Bank for International Settlements — Triennial Central Bank Survey]
A trader who expects a central bank to keep raising rates, for instance, may wait for a technical pullback to a prior support level before entering long, rather than buying immediately on the news. This does not eliminate risk — an unexpected data release or shift in market sentiment can override both the fundamental thesis and the technical setup — but it does give the trader a more structured framework than relying on either method in isolation.
Market sentiment also plays a bridging role between the two disciplines. [External Source: CFTC — Retail Forex Trading Information] Sentiment reflects how the broader market is currently interpreting fundamental developments, and it often shows up first in price action, which is why some traders treat sentiment and technical structure as an early warning system for fundamental shifts still working their way through the data.
What Should Traders Remember About Technical Analysis vs Fundamental Analysis?
Technical analysis and fundamental analysis answer different questions: one addresses timing, the other addresses direction and underlying value. Neither method guarantees profitable trades, and both carry risks that depend heavily on position sizing, discipline, and how a trader manages exposure to unexpected market moves.
Treating the two as complementary, rather than competing, tends to give traders a more complete picture. Economic data explains why a currency may be under pressure; price charts show how that pressure is actually being expressed in the market. Understanding both — and being honest about the limits of each — is a more durable foundation than searching for the one method that supposedly works best.


Leave A Comment